Canadian home sales remain at lower levels in November
Posted on December 20, 2012

Ottawa, ON, December 17, 2012 – According to statistics released today by The Canadian Real Estate Association (CREA), national home sales activity edged back down in November 2012 on a month-over-month basis, returning to where it stood in August. Demand geared down in August in the wake of tighter mortgage lending rules, and has since been running about eight per cent below levels in the first half of the year.
Highlights:
-
Home sales down 1.7% from October to November.
-
Actual (not seasonally adjusted) activity down 11.9% from November 2011.
-
Number of newly listed homes down 0.9% from October to November.
-
Housing market remains firmly in balanced territory.
-
National average price for home sales down 0.8% on a year-over-year basis in November.
-
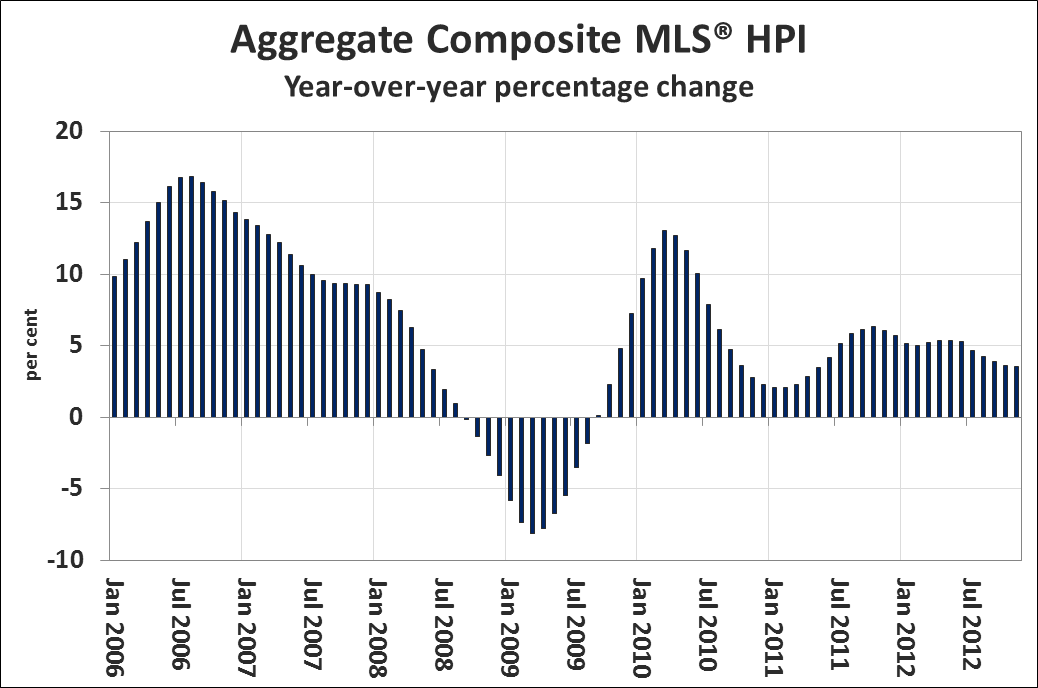
MLS® HPI up 3.5% in November, marking its smallest gain since May 2011.
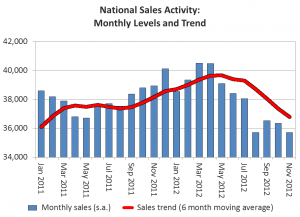
The number of home sales processed through the MLS® Systems of real estate Boards and Associations in Canada edged down 1.7 per cent on a month-over-month basis in November 2012. The decline returned activity to where it stood in August following the most recent tightening of mortgage regulations. (Chart 1)
Although down slightly on a national basis, activity picked up in roughly two of every five local markets in November including Vancouver Island, Victoria, Chilliwack, Kitchener-Waterloo, and Guelph. Greater Toronto, Greater Montreal, and Greater Vancouver contributed most to the small decline at the national level.
Actual (not seasonally adjusted) activity came in 11.9 per cent below November 2011 levels. Sales were down on a year-over-year basis in three of every four of all local markets in November, including most large urban centres. Calgary stood out as an exception, with activity up 10.6 per cent from a year ago.
“National sales activity has remained fairly steady at lower levels since mortgage rules were changed earlier this year, but that stability masks some real differences in trends among local housing markets,” said CREA President Wayne Moen. “As always, all real estate is local, so buyers and sellers should talk to their REALTOR® to understand how the housing market is shaping up where they live or might like to.”
“National sales activity lacks the momentum it had a year ago,” said Gregory Klump, CREA’s Chief Economist. “Interest rates have remained low and the economic backdrop has remained supportive for housing activity, so that should leave little doubt that recent changes to mortgage regulations are responsible for having cooled activity.”
A total of 432,861 homes have traded hands over Canadian MLS® Systems so far this year, down 0.2 per cent from levels reported over the first eleven months of 2011, and 0.8 per cent below the 10 year average for the period.
The number of newly listed homes fell 0.9 per cent month-over-month in November. Greater Vancouver posted the largest decline, with new supply there having fallen to its lowest level in more than two years.
With sales and new listings moving in the same direction and by similar magnitudes, the national sales-to-new listings ratio was little changed at 50.3 per cent in November compared to 50.7 per cent in October. Based on a sales-to-new listings ratio of between 40 to 60 per cent, three out of every five local markets were in balanced market territory in November.
The number of months of inventory is another important measure of balance between housing supply and demand. It represents the number of months it would take to sell current inventories at the current rate of sales activity, and it too was little changed in November.
Nationally, there were 6.6 months of inventory at the end of November 2012 compared to 6.5 months at the end of October.
The actual (not seasonally adjusted) national average price for homes sold in November 2012 was $356,687. This represents a decline of 0.8 per cent from November 2011.
The national average price continues to be influenced by compositional factors, most notably fewer sales in Greater Vancouver and Greater Toronto. Excluding these two markets from the national average price calculation yields a year-over-year increase of 3.2 per cent. This reflects year-over-year average sale price increases in two-thirds of all local markets in November 2012.
Unlike average price, the MLS® Home Price Index (MLS® HPI) is not affected by changes in the mix of sales, so it provides the best gauge of Canadian home price trends.

The Aggregate Composite MLS® HPI rose 3.5 per cent on a year-over-year basis in November. This was the seventh time in as many months that the year-over-year gain shrank, and marks the slowest rate of increase since May 2011. (Chart 2)
Year-over-year price gains decelerated for all Benchmark property types with the exception of the townhouse/row segment. Year-over-year growth remained strongest for one-storey single family home prices (+4.9 per cent) and two-storey single family homes (+4.2 per cent). Prices for townhouse and apartment units continue to post more modest gains, rising 1.8 per cent and 1.3 per cent respectively.
The MLS® HPI rose fastest in Regina (+11.6% year-over-year), although the increase was diminished compared to an increase of 13 per cent reported in October. MLS® HPI growth also moderated in Greater Toronto (+4.6% year-over-year) and in the Fraser Valley (+1.3% year-over-year).
By contrast, the MLS® HPI saw year-on-year growth accelerate in Calgary (+7.1%) and Greater Montreal (+1.9%). In Greater Vancouver, the MLS® HPI posted a 1.7 per cent year-over-year decline in November.
– 30 –
PLEASE NOTE: The information contained in this news release combines both major market and national MLS® sales information from the previous month.
CREA cautions that average price information can be useful in establishing trends over time, but does not indicate actual prices in centres comprised of widely divergent neighborhoods or account for price differential between geographic areas. Statistical information contained in this report includes all housing types.
MLS® is a co-operative marketing system used only by Canada’s real estate Boards to ensure maximum exposure of properties listed for sale.
The Canadian Real Estate Association (CREA) is one of Canada’s largest single-industry trade associations, representing more than 106,000 REALTORS® working through more than 100 real estate Boards and Associations.